top of page

Humphris Farm, Tongala
Pasture Accumulation Rates
(kgDM/ha/day)
The following figures were calculated using readings from the Automated Pasture Reader (APR) and calibration cuts taken through the same time period. For details on the methodology, see here.
The figures in the first column are derived from previous research: R. Stockdale (1983) 'Irrigated pasture productivity and its variability in the Shepparton region of northern Victoria' Australian Journal of Experimental Agriculture and Animal Husbandry 23(121) 131 - 139


PERENNIAL RYEGRASS
PERENNIAL RYEGRASS + PASPALUM
Nutritional Information
Pasture samples were tested using Near Infrared Reflectance spectroscopy (NIR) and the DairyOne method. For further information on this method, click here. Samples were taken just prior to grazing. Where there were multiple samples for a given month, results have been averaged (mean).
Cost of Production
($/tDM/month and annual)
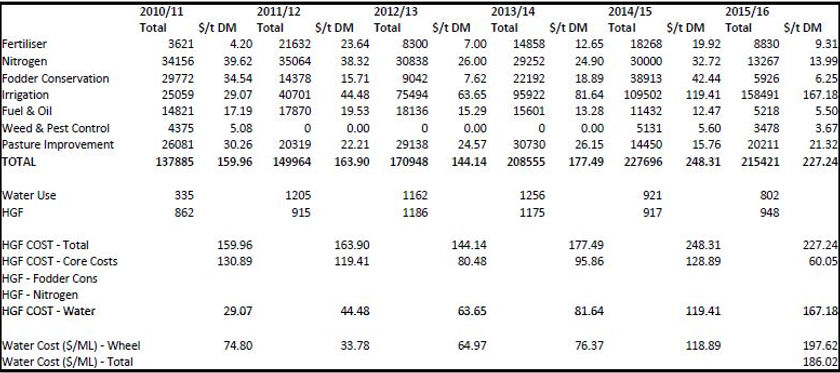
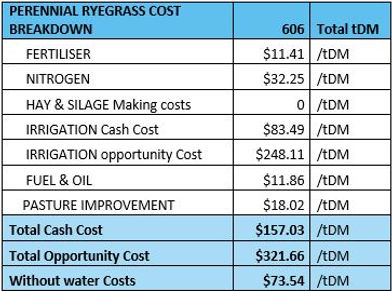
The following costs were calculated using the above numbers in conjuction with water, fertiliser, labour, pest control and oil and fuel costs.
PERENNIAL PASTURE
Accumulation Rates
(kgDM/ha/day)
The following figures were calculated using readings from the Automated Pasture Reader (APR) and calibration cuts taken through the same time period. Measurements were taken on two bays watered at different irrigaiton intervals and on an adjacent bay that was dried off in December. For details on the methodology, see here.
Nutritional Information
Pasture samples were tested using Near Infrared Reflectance spectroscopy (NIR) and the DairyOne method. For further information on this method, click here. Samples were taken just prior to grazing. Where there were multiple samples for a given month, results have been averaged (mean).
Cost of Production
($/tDM/month and annual)
The following costs were calculated using the above numbers in conjuction with water, fertiliser, pest control, labour and oil and fuel costs.

LONGER IRRIG INTERVAL (DARK BLUE)
SHORTER IRRIG INTERVAL (LIGHT BLUE)

LONGER IRRIG INTERVAL (LIGHT BLUE)
SHORTER IRRIG INTERVAL (DARK BLUE)
DRIED OFF
Stewart-Matthews Farm, Yarrawalla
LUCERNE
Accumulation Rates
(kgDM/ha/day)
The following figures were calculated using readings from the Automated Pasture Reader (APR) and calibration cuts taken through the same time period. Measurements were taken on two bays watered at different irrigaiton intervals. For details on the methodology, see here.
Nutritional Information
Pasture samples were tested using Near Infrared Reflectance spectroscopy (NIR) and the DairyOne method. For further information on this method, click here. Samples were taken just prior to grazing. Where there were multiple samples for a given month, results have been averaged (mean).
Cost of Production
($/tDM/month and annual)
The following costs were calculated using the above numbers in conjuction with water, fertiliser, pest control and oil and fuel costs.


Accelerating Change
bottom of page